
|
KiCADKicad
|
|

|
Python |
|

|
PlatformIOPlatformIO Labs
|
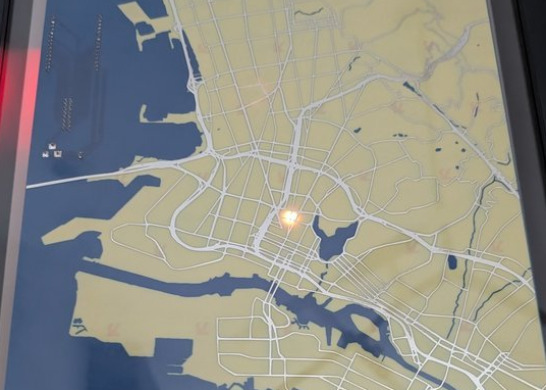
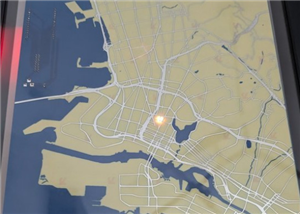
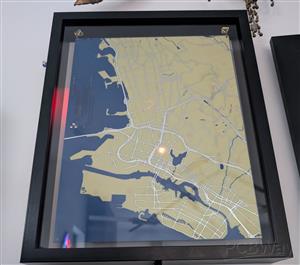
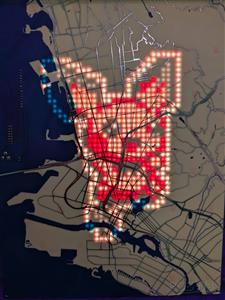
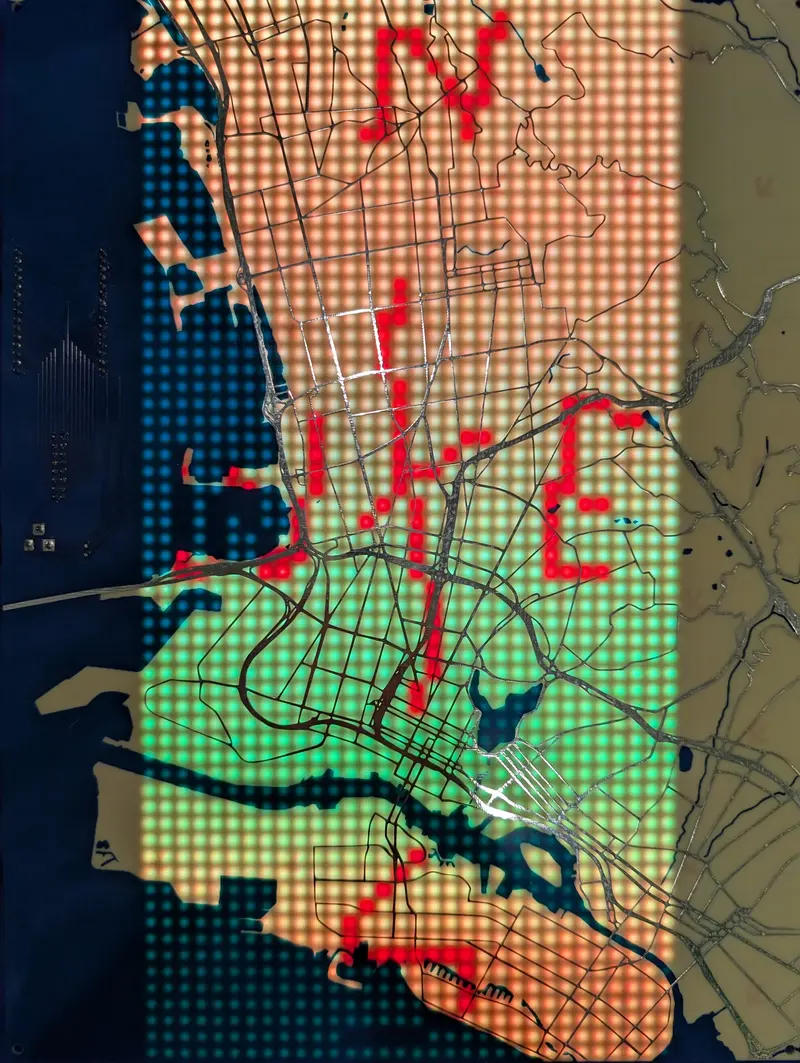
Location Display Map with PCB Art
I had a PCB board built that shows a map of the Easy Bay in California. I put an LED matrix behind the PCB so that it can shine lights through. I use this to display shared locations, and the routes to events from my calendar.
Brainstorming
I wanted to create a PCB art project that really showcased the PCB as part of the project's functionality.
I spent some time specifically looking at other PCB art projects. There’s a lot of beautiful stuff out there. One site I found particularly interesting was Boldport. In particular, https://boldport.com/blog/2013/09/the-lifegame.html reminded of my recent wedding project. They actually have a whole design tool for PCB art https://github.com/boldport/pcbmode which I looked into. Unfortunately, it seems like the site and the tool haven’t really been active for a few years.
Another PCB art project that inspired me was https://chaijiaxun.com/blog/pcb-metro-map-build-log/. The author created meticulous transit maps as PCBs with light animations.
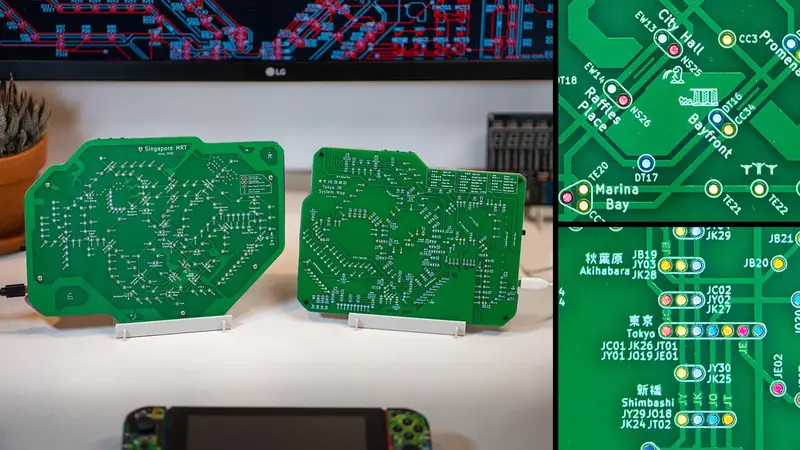
These two projects both dealt with illuminating PCB’s from the back. I used them as points of reference as I settled on my own design. The creator of the PCB Metro Map Chai Jia Xun in particular spent a lot of effort on perfecting his approach. He ended up shining light through the via holes in the board, coloring them with paper, and using a printed mask to avoid light leaking between holes.
With my prior art research done, I focused on coming up with my own design.
My default instinct for an interesting display project is always to turn it into a clock. I explored designs that combined static PCB artwork with dynamic elements like LEDs, LCDs, e-ink panels, and seven-segment displays. I considered building a traditional clock, a calendar, and even an orrery. But the more I explored those ideas, the more conventional they felt. I wanted something stranger and more personal.
In the end, the most interesting direction was a display that reflected the daily rhythms of my family in real time.
Of course, this takes inspiration from the “Weasley family clock” from Harry potter. Many people have made beautiful projects recreating the clock, and a few that incorporate the electronics to make it function like in the books as well. To put my own spin on it, I decided to combine the idea with the PCB Metro Map to make the display a map.
PCB Design
I usually try to make my projects as automated and repeatable as possible (often to a fault). I’ll spend far more time building tooling and infrastructure than it would take to do a one-off task manually. For the map artwork, though, I gave myself permission to just wing it and focus on getting the design finished as directly as possible.
I initially considered using the Boldport PCBmodE tool, but it appeared to be unmaintained and seemed like it would come with a steep learning curve. Instead, I decided to try the image converter now built into KiCad.
Since the KiCad converter only works with bitmap images (JPGs, PNGs, and similar formats), I didn’t need to worry about building everything as vector artwork.
I was surprised by how difficult it was to find a good source for the map imagery. If I had wanted to be truly meticulous, there are probably mapping APIs that expose the underlying geographic features directly so you can render everything exactly how you want. Instead, I mainly needed an online map tool where labels (road names, points of interest, etc.) could be disabled cleanly.
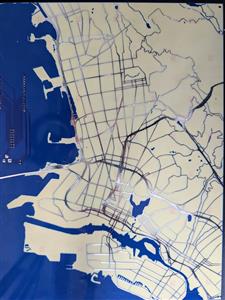
Eventually, I found Snazzy Maps, which was almost exactly what I was looking for. It provides a JSON-based styling interface with fairly fine-grained control over map appearance. I started from the existing Assassin’s Creed IV style and disabled railroads and local streets.
The site includes an export button, but it only supports images up to 1000x1000 pixels. Instead, I rendered the map at high resolution and captured screenshots manually.
Next I had to decide what map features I wanted to have on which PCB layers.
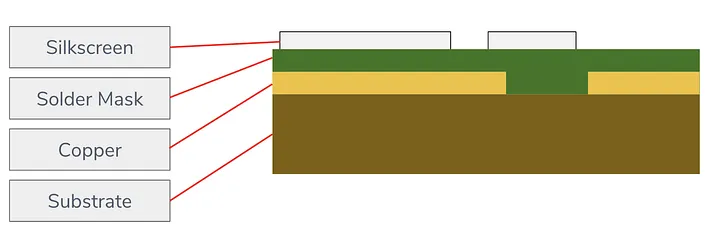
PCBs normally have these layers on both the front and back of the board, though additional copper layers can also be sandwiched internally. Since I planned to shine light through the PCB, I realized I could also use the back-side layers to block or dim light without affecting the visible front surface. Vias (the plated holes that connect copper layers together) could even be used to channel light directly through the board.
In the end, I decided to keep things simple:
- Solder mask for water
- Exposed copper for streets
- Bare PCB substrate for land
Device Software
From the start, I knew I wanted to keep the panel firmware as simple and generic as possible. Ideally, I could reuse it for other display projects in the future. The device would receive commands over MQTT to drive all dynamic behavior.
This also meant I would need to write a separate host-side application to run on a PC, responsible for querying family locations and translating that data into commands sent to the device.
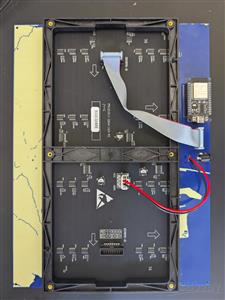
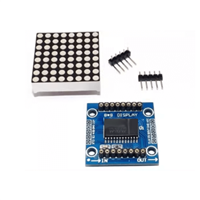
I bought the LED matrix panel with the hope that controlling it wouldn’t be too much of a pain. From what I can tell, HUB75 is an informal standard that many LED panels implement https://learn.lushaylabs.com/led-panel-hub75/. Since it’s informal, there are many small variations that need to be validated when buying a new model.
The matrix display that this project was tested with is the: Waveshare RGB Full-Color LED Matrix Panel, 5mm Pitch, 64x32 Pixels
It was labeled as P5(2121)-3264-16S-M5 (32x64 1/16 scan) and used the RUC7258D, SM16208SJ, and MW245BC control chips.
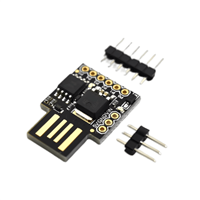
Like most embedded projects, finding the “best” library to use is a bit of a pain. It seems many owe their ancestry to the Adafruit graphics library, which has many descendants targeting different platforms and display technologies. After some research, I decided that the https://github.com/mrcodetastic/ESP32-HUB75-MatrixPanel-DMA library seemed to be the most capable and compatible option for the ESP32.
I built a PlatformIO Arduino project to control the panel on from a ESP32. Most of the code handled provisioning and discovery to make sure that the panel would be easy to setup and use. The rest of the code handled the MQTT commands to draw on the panel.
First, I added an interface for drawing a background image. This is simply sending a bitmap of pixel colors for the whole panel to be statically displayed when nothing else overwrites them. When I started testing this, I realized that the MQTT library I was using had a 256-byte message limit. Since I didn’t want to rely on sending 4 KB (64x32x2 bytes, where 2 bytes per pixel is the RGB565 color scheme) messages, I set up the interface to update the background row by row (128-byte payloads).
I also wanted to support drawing elements that could be updated independently and could have some dynamic behaviors (e.g., pulsing). I created a concept of sprites indexed by a name identifier. The only sprite type I implemented was a pixel sprite that could oscillate between two colors. This also enabled the panel to periodically cycle between sprites sharing the same position, to handle the case where multiple people were at the same address and I wanted both to appear on the map. These sprites could then be updated by future commands referencing their name. There are other sprite types I could have added (such as driving routes) but I decided not to add complexity to the firmware until it was actually needed.
Server Software
Once the device is fully configured, further operation is controlled over MQTT. This tool handles that control for various tests and applications.
The main application is display-shared-locations. It loads the user’s and their friends’ positions to draw on the map, and checks calendar events for positions to draw routes to.
For testing purposes I also created a way to specify changing user positions and routes as a JSON file.
One issue I hit while developing this interface is that there’s no great way to access your location data over an API from Google. Google tracks your position and lets you share it with friends through Google Maps, but there’s no official way to access this data outside the app or website. There is a Python library that handles parsing the data, but it requires session cookies, which can be fragile for a long-running server.
I could use a side channel to report positions, but I wanted to avoid requiring my family to run any special software on their phones. Both for simplicity and for privacy.
Position data could also come from other services. If my kids get some sort of non-phone location beacon (like an AirTag), I could potentially integrate that as well, since it would just be an update to the Python server.
Calendar data turned out to be much simpler to get since Google supports a real API for generating tokens to access a user's calendar data.
Drawing the routes was a bit more involved. I initially used an API from OpenRouteService since its free tier would have covered my usage, but it returned incorrect positions for the test addresses I tried. I switched to the Google Maps routing API, which requires a Google Cloud account but should also be effectively free.
Converting user locations to panel coordinates was a fairly straightforward mapping from latitude/longitude to the panel’s X/Y. Drawing routes was more complex: I receive the route as a series of line segments and need to map these onto the grid. The algorithm I used could almost certainly be improved, but I got something quick and dirty working.
I decided to add route drawing later in the process. Rather than adding a new sprite type for routes, I found it easier to draw them as part of the background image and manage them from the server side.
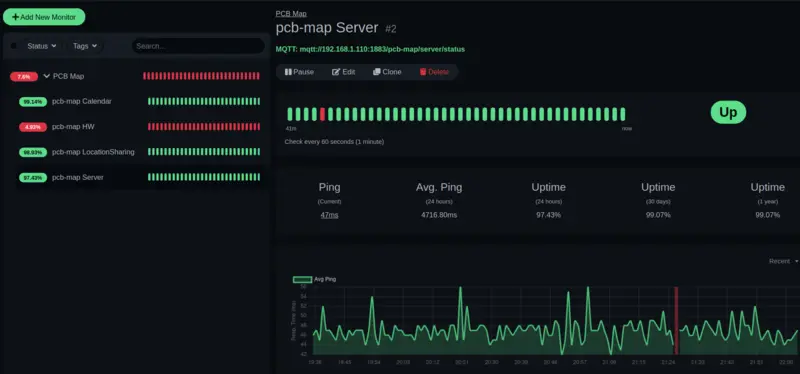
Once I had everything working, I spent some time hardening the application so it would behave more reliably as a long-running server process. I added MQTT status reporting so I could monitor whether the hacky cookie sharing mechanism needed to be refreshed or if some other unexpected failure had occurred.
To run it on my server, I Dockerized the application and wrote scripts to update the authentication credentials as needed. I also set up Uptime Kuma to monitor the service and alert me if anything failed.
Results
In the end I got everything I wanted working. All designs and code for this project can be found at: https://github.com/axlan/pcb-map
See https://www.robopenguins.com/pcb-map/ for the original design process and build write up.
Location Display Map with PCB Art
*Wpsload community is a sharing platform. We are not responsible for any design issues and parameter issues (board thickness, surface finish, etc.) you choose.


Attribution-ShareAlike (CC BY-SA) License
Read More⇒


Raspberry Pi 5 7 Inch Touch Screen IPS 1024x600 HD LCD HDMI-compatible Display for RPI 4B 3B+ OPI 5 AIDA64 PC Secondary Screen(Without Speaker)
BUY NOW


- Comments(1)
- Likes(0)
 More by Engineer
-
-
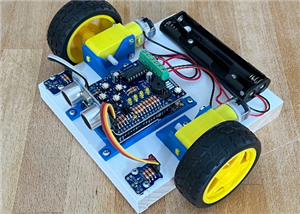
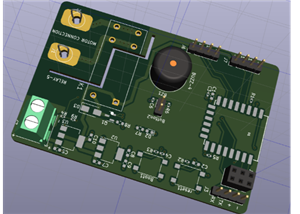
ARPS-2 – Arduino-Compatible Robot Project Shield for Arduino UNO
2538 0 5 -
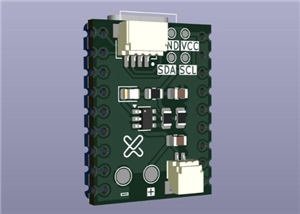
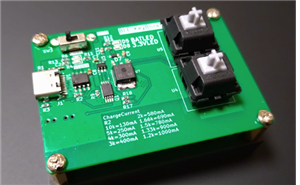
A Compact Charging Breakout Board For Waveshare ESP32-C3
2994 3 8 -
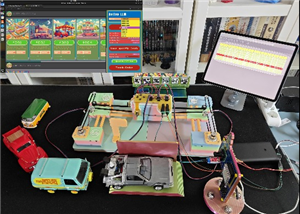
AI-driven LoRa & LLM-enabled Kiosk & Food Delivery System
3202 2 1 -
-
-
-
ESP32-C3 BLE Keyboard - Battery Powered with USB-C Charging
3269 0 2